
Today, social networks are one of the pillars of digital marketing. However, publishing content without analyzing its impact is like navigating blindly. That's why we analyzing the right statistics is essential to optimize your online presence and reach your objectives (visibility, engagement, conversions).
Whether for an organic or paid strategy, mastering the right metrics is essential to optimizing your presence on social networks. If you'd like to go one step further and put your advertising campaigns in the hands of experts, take a look at our Facebook Ads agency to help you manage and optimize your ads.
In 2025, as algorithms and trends evolve rapidly, it is crucial to rely on reliable metrics to make informed decisions. This article guides you through 8 key statisticsby explaining how to measure them, why they are important and how to optimize them.
Reach: Measuring the extent of your audience
Definition and significance
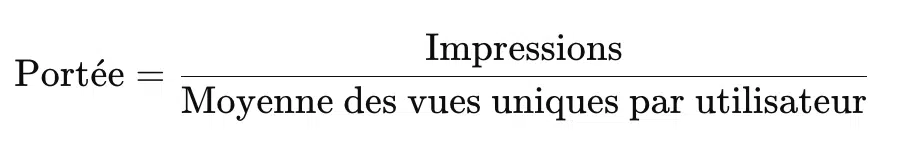
Visit scope is the number of users unique who have seen your publication at least once. Unlike prints (which count all views, including repeats by the same person), the scope measures theactual exposure of your content.
A high range indicates that your publication is visible and distributed by the algorithm, while a short range means that your content is limited to a small audience.
How do I calculate the span?
It is generally provided by the platforms' analytics tools, but can be estimated with :
Data and trends in 2025
- Facebook the average organic range is 5,2 % page subscribers, in constant decline since 2020 (Hootsuite).
- Instagram the Reels have 2 to 3 times greater organic reach than classic posts.
- LinkedIn carousels and long posts generate up to 40 additional % range compared to short posts.
How to optimize reach?
✅ Publish at the right time Test different time slots to identify those where your audience is most active.
✅ Encourage interaction The more comments, shares and reactionsthe more it will be favored by the algorithm.
✅ Use engaging formats : Short videos and carousels boost reach by encouraging interaction.
If you want to maximize the impact of your publications on LinkedIn and understand which formats work best, check out our detailed guide to 7 types of high-performance LinkedIn publications in 2025.
Impressions: Understanding Display Frequency
Definition and difference from Scope
Unlike the range, the prints account for each display of a publication, even if it is viewed several times by the same person.
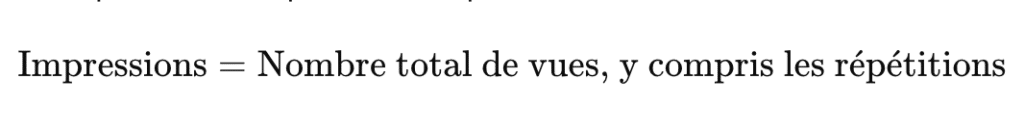
A high impression may indicate that your content is reused by the algorithm and that it is regularly displayed to users.
Why Impressions Are Crucial
- They show whether your content is sustainable or quickly disappears from the news feed.
- A low impression on a sponsored post can mean ineffective targeting.
How to increase Impressions
✅ Repost high-performance content at different times.
✅ Use stories and ephemeral publications (they increase the repetition of views).
✅ Add hashtags and keywords to maximize visibility.
Mentions and Shares: Notoriety indicators
Definition and Impact
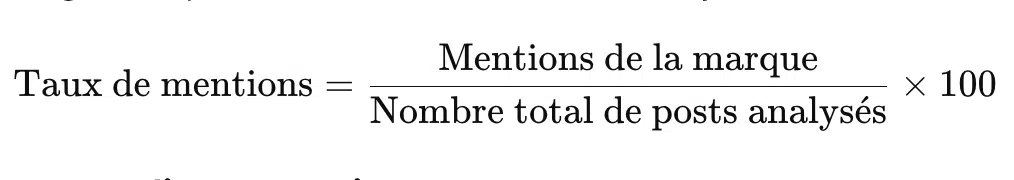
Visit details measures the number of times your brand is mentioned in posts or comments, while shares indicate how many users have relayed your content.
Why is it a Powerful Indicator?
- An increase in mentions means strong brand awareness and virality.
- Visit shares are a key signal for the algorithms, which prioritize widely distributed content.
How can I increase Mentions and Shares?
✅ Encourage UGC (User-Generated Content) Get your subscribers talking about you.
✅ React and engage in discussion : Respond to mentions to maximize conversation.
✅ Create shareable content : Infographics, tutorials and inspirational quotes are the most widely shared.
Engagement Rate: Measuring Audience Interaction
Definition and formula
Visit commitment rate measure user interaction with your posts (likes, shares, comments).
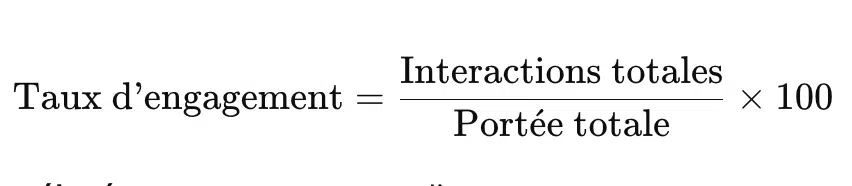
A high engagement rate shows that your audience finds your content relevant and interesting.
Data and Trends
- Short videos generate 47 % more engagement than still images (Social Media Examiner).
- LinkedIn posts with personal storytelling register +30 % engagement.
Strategies for increasing engagement
✅ Ask open-ended questions to encourage comments.
✅ Add a call to action (CTA) (e.g. "Give your opinion as a comment!").
✅ Respond actively to comments to stimulate the algorithm.
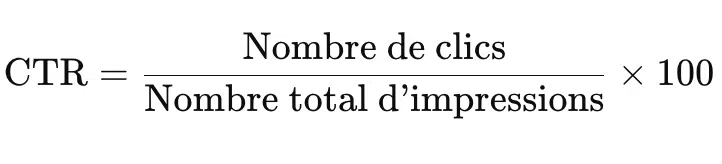
Click-Through-Rate (CTR): Evaluate the Attractiveness of your Publications
Visit click-through rate (CTR) is an essential metric for measuring the effectiveness of your publications in generating interest and active engagement. It indicates how many of those who saw your publication clicked on a link or call-to-action (CTA) button.
📌 How do I calculate CTR?
The formula is as follows:
Example:
If a publication has been viewed 10,000 times and generated 500 clicksthen :
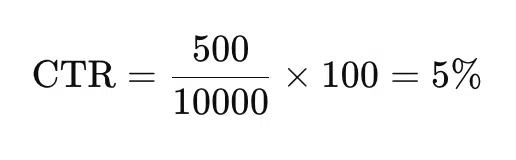
A High CTR indicates that your publication is attractive and that your audience is encouraged to interact with your content. A Low CTR means that your message, visual or CTA is not sufficiently engaging.
📊 Studies and trends in 2025
- The average CTR of organic publications on Facebook is 0,9 %while paid advertising can reach 3 to 5 % (HubSpot).
- Publications containing figures in their title ("5 tips...", "The 10 best...") have a CTR 20 % higher.
- Short videos on TikTok and Instagram generate 3 times more clicks than static images.
💡 Strategies for increasing CTR
✅ Write powerful titles Use action verbs and trigger words ("Discover", "Download", "Learn").
✅ Optimize your visuals vivid colors and human faces increase click-through rates by 35 %.
✅ Add a clear CTA Click here", "Try it now", "Download for free".
✅ Test several formats compare carousels, videos and images to see what works best.
If you want to go further and launch an effective advertising campaign on LinkedIn, discover our detailed guide : LinkedIn campaign: How do I get started?
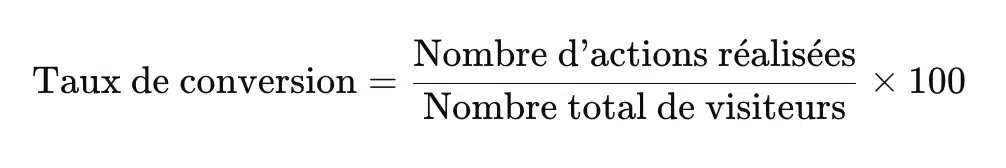
Conversion rate: Turning visitors into customers
Visit conversion rate measures the effectiveness of your publications at encourage users to take action (purchase, registration, download).
📌 How do I calculate the conversion rate?
Example:
If 1,200 visitors have clicked on a link to your site and 60 have made a purchasethen :
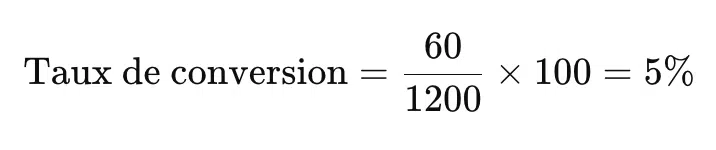
A high conversion rate means that your content attracts a qualified audience and that your offer is relevant.
📊 Trends and benchmarks in 2025
- The average conversion rate for social networks is 1,85 %with variations depending on the platform:
- Facebook Ads : 9,21 %
- Instagram Shopping : 3,1 %
- TikTok Ads : 1,1 %
- Videos with customer testimonials increase the conversion rate by 37 %.
- Well-optimized landing pages generate 2 times more conversions.
💡 How can you improve your conversion rate?
✅ Target the right audience Segmentation: use segmentation tools to reach the users most likely to take action.
✅ Optimize your landing page A well-placed CTA and a clean design increase conversions by 50 %.
✅ Add testimonials and social proof users put more trust in the opinions of other customers.
✅ Simplify the action process limit the number of steps required to complete a purchase or registration.
Audience Growth: Tracking the Evolution of Your Community
Tracking the evolution of your audience allows you to measure your brand's appeal on social networks. A steadily growing audience reflects good positioning and an effective strategy.
📌 How do you measure audience growth?
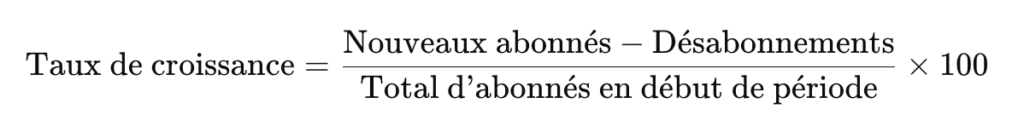
Example:
If you start the month with 10,000 subscribersthat you earn 1,500 new subscribersbut lose some 300then :
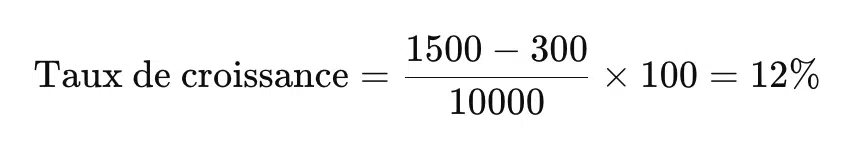
A positive growth rate indicates that your content attracts new subscribers and builds loyalty among the existing audience.
📊 Data and trends in 2025
- On average, companies on LinkedIn gain 2.5 % subscribers per month.
- Short videos and lives generate 5 times more subscriptions than images.
- Influencers record growth rates of up to 20 % per month by publishing daily.
💡 How can you accelerate the growth of your audience?
✅ Publish valuable content on a regular basis a good mix of entertainment, education and inspiration.
✅ Use collaborations Partnering with influencers increases reach and subscription rates.
✅ Animate your community Ask questions, respond to comments and engage in discussion.
✅ Offer incentives contests, giveaways and special offers for new subscribers.
Audience Sentiment: Understanding Brand Perception
Visit audience sentiment analyzes users' opinions of your brand. It identifies whether your image is perceived positively or negatively.
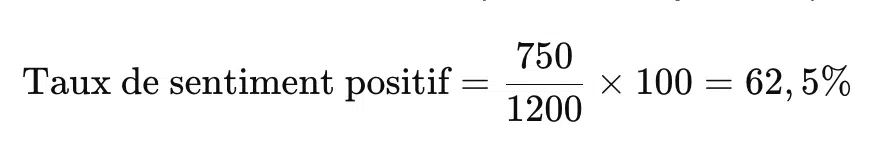
📌 How do you measure audience sentiment?
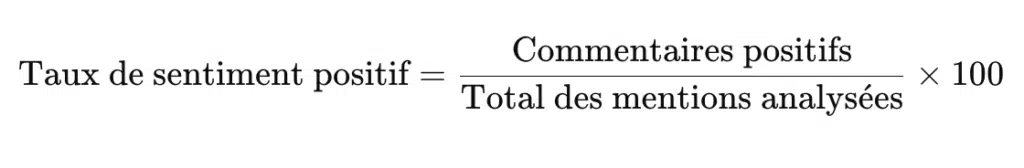
Example:
If your brand receives 1,200 mentions on Twitter and 750 are positivethen :
📊 Trends and analysis
- 60 % of consumers abandon a purchase if a brand has a negative image.
- Brands that respond to negative reviews increase their goodwill by 30 %.
💡 How can you improve the sentiment of your audience?
✅ Keep an eye on reviews and comments with tools such as Mention and Brandwatch.
✅ Respond to criticism with empathy and propose solutions.
✅ Highlight your values and commitments (CSR, ethics, transparency).
Conclusion: Using Statistics for a Winning Social Networking Strategy in 2025
In 2025, social networks are more than ever an essential lever for brands and content creators. But publishing content is no longer enough: with evolving algorithms and increased competition, performance analysis is the key to success.
Visit 8 key statistics discussed in this article can be used to assess all the dimensions of an effective digital strategy. The scope and prints indicate the visibility of your content, while the details and shares measure your notoriety and virality. But success doesn't stop at being seen: engagement rate and CTR show whether your content generates real interactionand the conversion rate reveals its commercial impact.
Finally, audience growth and community sentiment analysis help you understand the evolution and perception of your brand. A growing audience and positive sentiment are signs of an effective strategy, while a slowdown or negative perception calls for adjustments.
Towards a Data-Driven Approach and Continuous Optimization
Too often, companies and content creators limit themselves to tracking the number of subscribers or likes, without analyzing what really generates results. But every detail counts: type of content, frequency of publication, quality of visuals, relevance of CTAs... Everything needs to be tested and optimized using concrete data.
Social networks are not a random playground, but an ecosystem where experimentation and analysis are the best assets. In 2025, successful brands and creators will be those who use these metrics to refine their strategy, maximize engagement and turn their audience into loyal customers.
By applying these principles, you can turn social networks into a powerful growth lever for your company.
If you want to maximize the impact of your LinkedIn campaigns and achieve concrete results, our agency Daware.io is here to support you. As LinkedIn advertising specialists, we help companies define their strategy, optimize their campaigns and improve their return on investment. Thanks to our in-depth expertise and advanced tools, we offer you a tailor-made approach to achieving your marketing objectives. Contact Us today and turn LinkedIn into a real growth lever for your company!
